After comprehensive testing of their beta product last year, Google announced in January that they would be rolling out the beta version of the Google Search Console to all users (yay!).
The intent is to help webmasters better optimise their website’s presence on Google Search.
If you’ve never heard of this tool at all, it’s an amazingly free service by Google to check all crawling and indexing related aspects of your site that may be impacting your search results.
Also, if you’ve never heard of it at all, what are you waiting for? Set it up for your website today!
With the beta version still getting new features added, the older standard version of Search Console will continue to be live for all users and both can be used side by side.
Until that process is complete, webmasters will be able to access both versions via a link in the navigation bar. If you’re clinging to the older version for dear life, then this is the most comprehensive guide that I could find – read it here.
The Performance Report
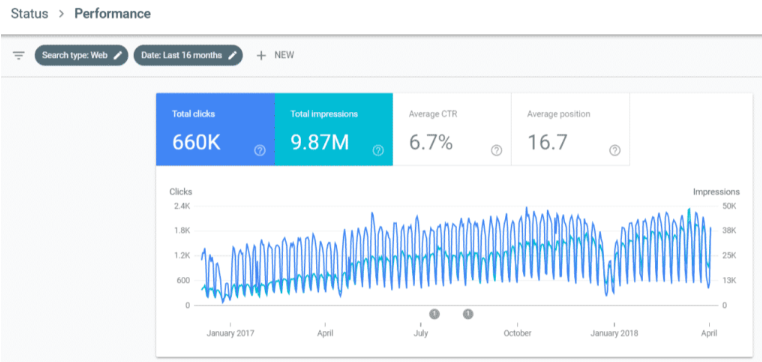
Displays all the important metrics about how you are performing in the search engine result pages (SERPs) including most common search keyword queries, most popular pages, any special rich results and more. The amount of data provided has been expanded to 16 months of data (previously 3 months), which is useful to compare year-on-year trends.
The top summary chart will show you key metrics, including total clicks (how many times users click on your listings), impressions (how many times your search listings appear in the SERPs), average click-through rate (the rate of clicks divided by impressions), and average position (aggregated average position of all rankings).
You can click on these metrics to include them in the reporting table. With the search type option, you can specify whether you want to see web, image or video search results. With the date option, you can change the date range of the report to use other predefined ranges, such as the last 16 months or even compare different date ranges, which is very important for comparing performance over time.
The performance report also gives in-depth data on performing queries, pages, devices and even countries.

Index coverage report
Any indexing issues with your website will be explained, including the specified URLs affected when you drill down by the status report. Learn which pages have been indexed and identify any spikes in indexing errors.
This report breaks down issues into:
- Errors – Pages that could not be indexed won’t appear in the SERPs e.g. pages that have been accidentally no-indexed.
- Valid with warnings – Pages that have been indexed but potentially shouldn’t be e.g. pages blocked by the robots.txt.
- Valid – Pages that have no issues as they are successfully indexed.
- Excluded – Pages that were intentionally not indexed and not appearing in the SERPs e.g. archived pages or tag pages.

Sitemaps report
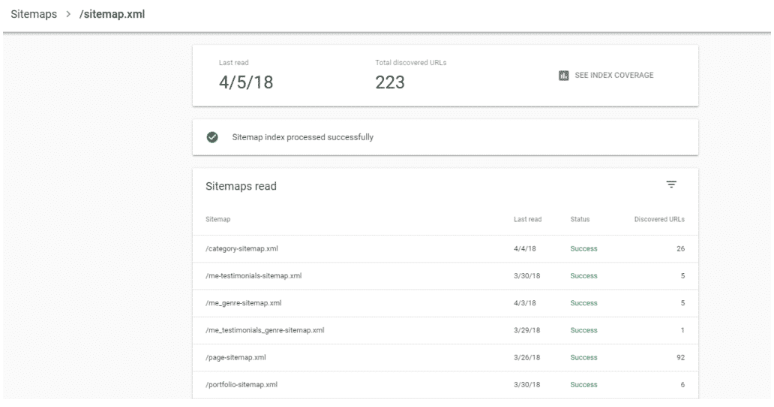
Find out how Google tracks the processing of your sitemap/s and if any processing errors would require you to submit a new one. This tool is easy to use as you specify and submit your XML sitemap URL. It shows the last read date, how many URLs were discovered and the historical information about previous sitemaps submitted.

AMP status report
With many websites utilising accelerated mobile pages (AMP) for the best mobile experience, Google recognises that AMP websites are more valuable, and this report assists with fixing any errors preventing AMP pages from appearing in the SERPs. It also shows which specific URLs are impacted and the reason for errors.

Job postings status report
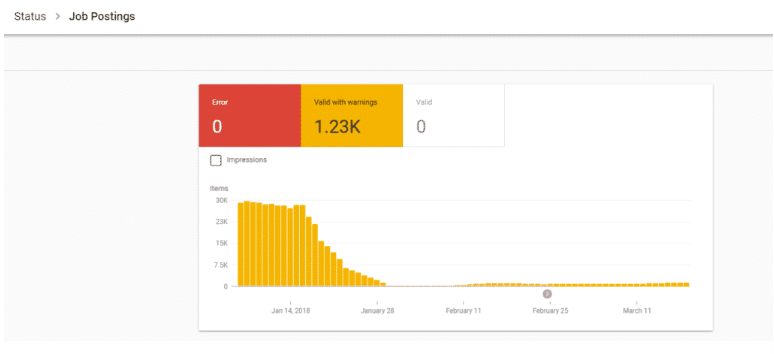
Mostly for recruitment or job websites that post job listings, this report will show statistics around your job listing results, any indexing issues and a way to resolve those issues.

Written by
Brίd Flynn


