GA4 Reporting 101
Welcome to the exciting world of Google Analytics 4 (GA4) reporting! I'm here to help you become a GA4 whiz and uncover all the insights in your data.
This guide will break down the basics, walk you through the reports, and show you how to create custom exploration reports, one of GA4's strongest reporting features.
Reports vs Explorations: Navigating the GA4 reporting interface
Essentially GA4 offers two distinct ways to analyse your data: reports and explorations.


Reports
- These pre-built dashboards focus on key areas like user acquisition, engagement, and monetisation.
- They're a great starting point, offering quick insights into core metrics.
- A structured overview lets you access your most important metrics at a glance.
Explorations
- Allows you to build tailored reports by dragging and dropping dimensions and metrics, creating funnels to analyse user journeys, and applying segments to gain a deeper understanding of specific user groups.
- These reports function as a customisable workspace, utilising a flexible "analysis workspace" approach.
- Explorations empower you to ask specific questions of your data and uncover unique insights.
The 4 best GA4 reports
GA4 offers a variety of pre-built reports that provide valuable insights straight out of the box. Below we'll explore which Google Analytics reports are the most useful and why.
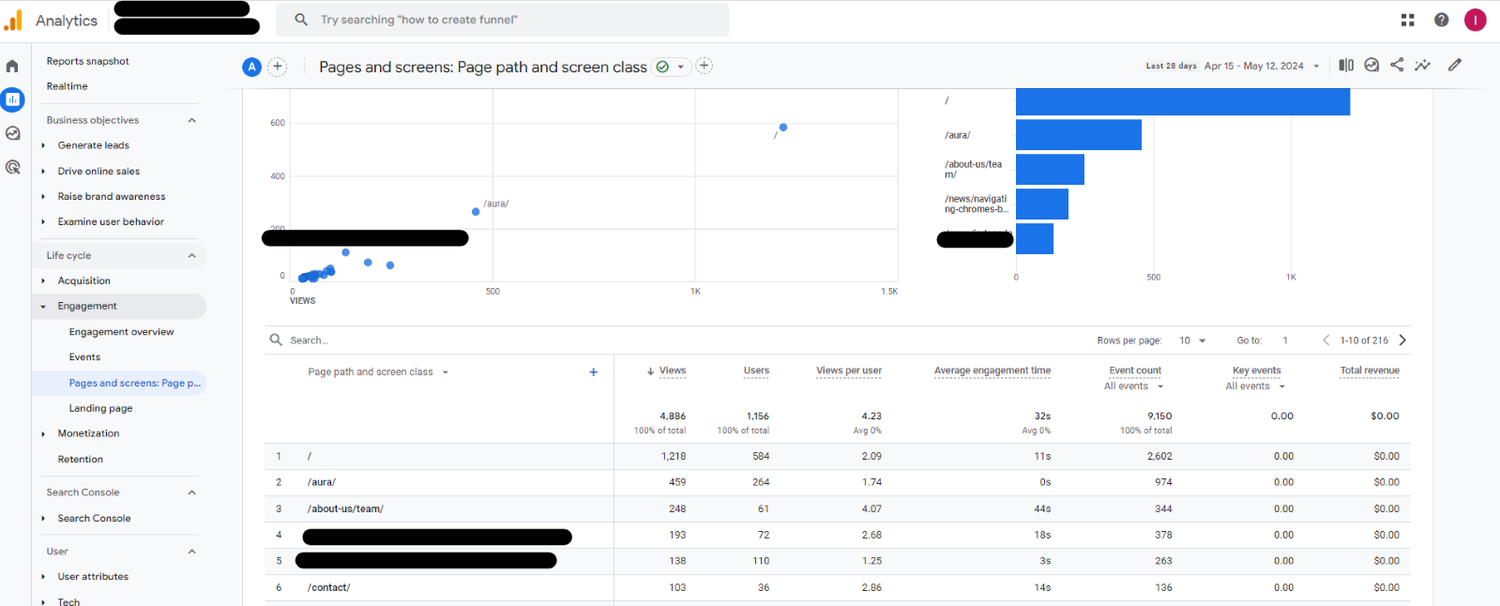
1. Engagement – Pages and Screens
This report unveils which pages or screens receive the most traffic and user engagement. Analyse time spent, bounce rate, and scroll depth to identify high-performing content and areas for improvement.


2. Engagement – Events
This report details all tracked events, allowing you to understand user interactions beyond page views. Analyse clicks, form submissions, video plays, and other events to gain a deeper understanding of user behaviour.


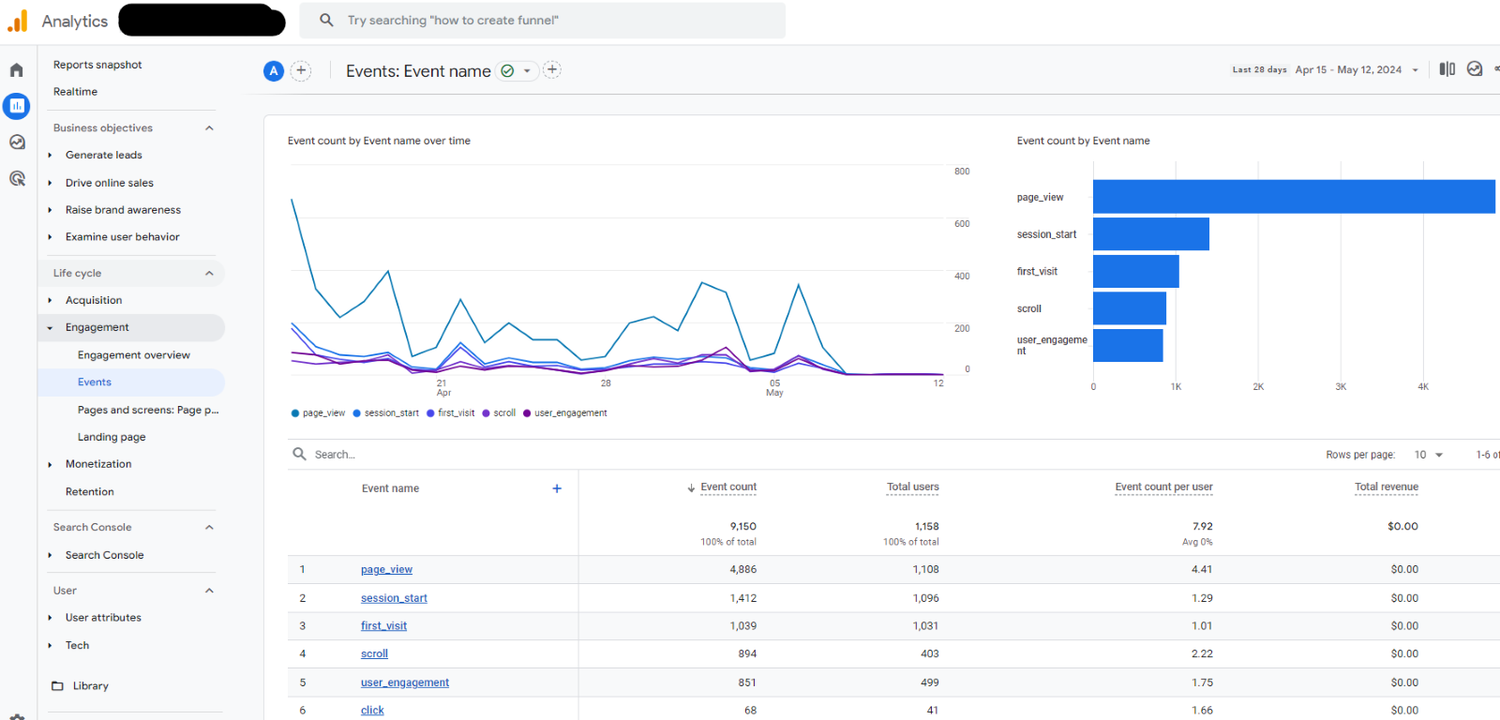
Learn more about Events vs Key Events in GA4.
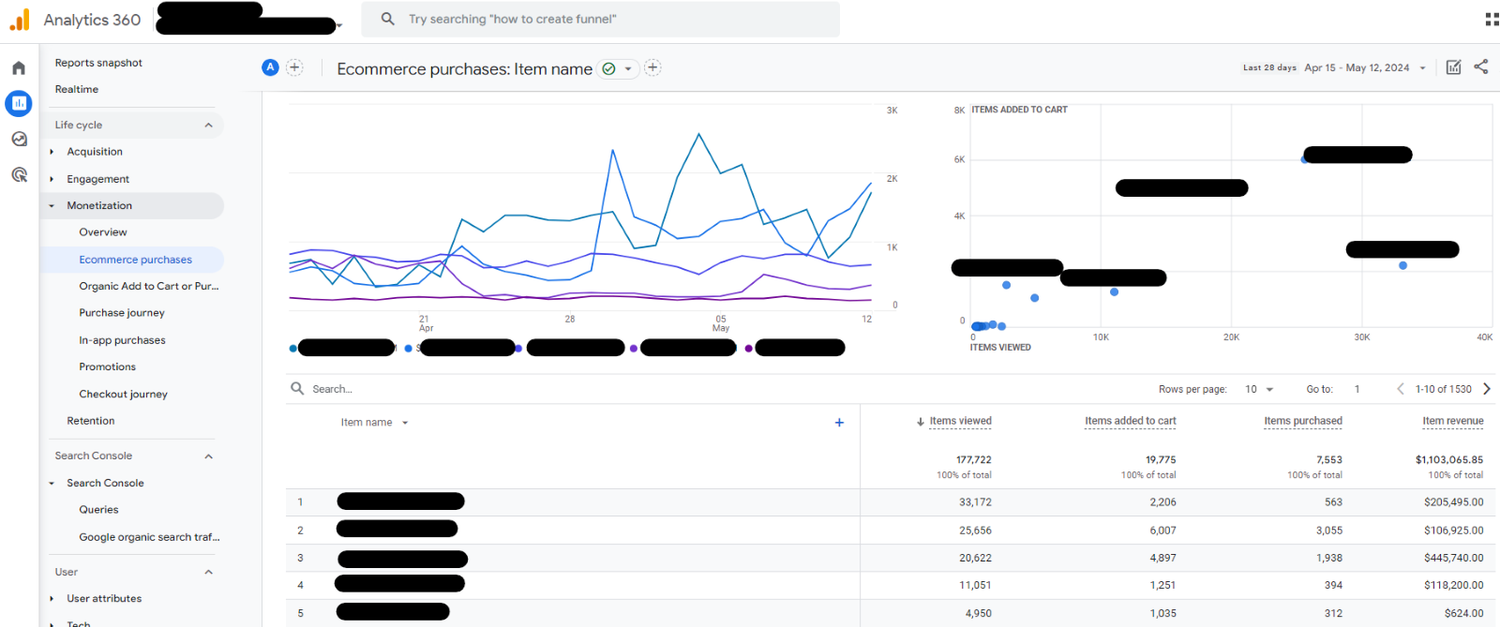
3. Monetisation – E-commerce purchases
Here you can analyse purchase data such as revenue, average order value, and product popularity to optimise your e-commerce strategy.


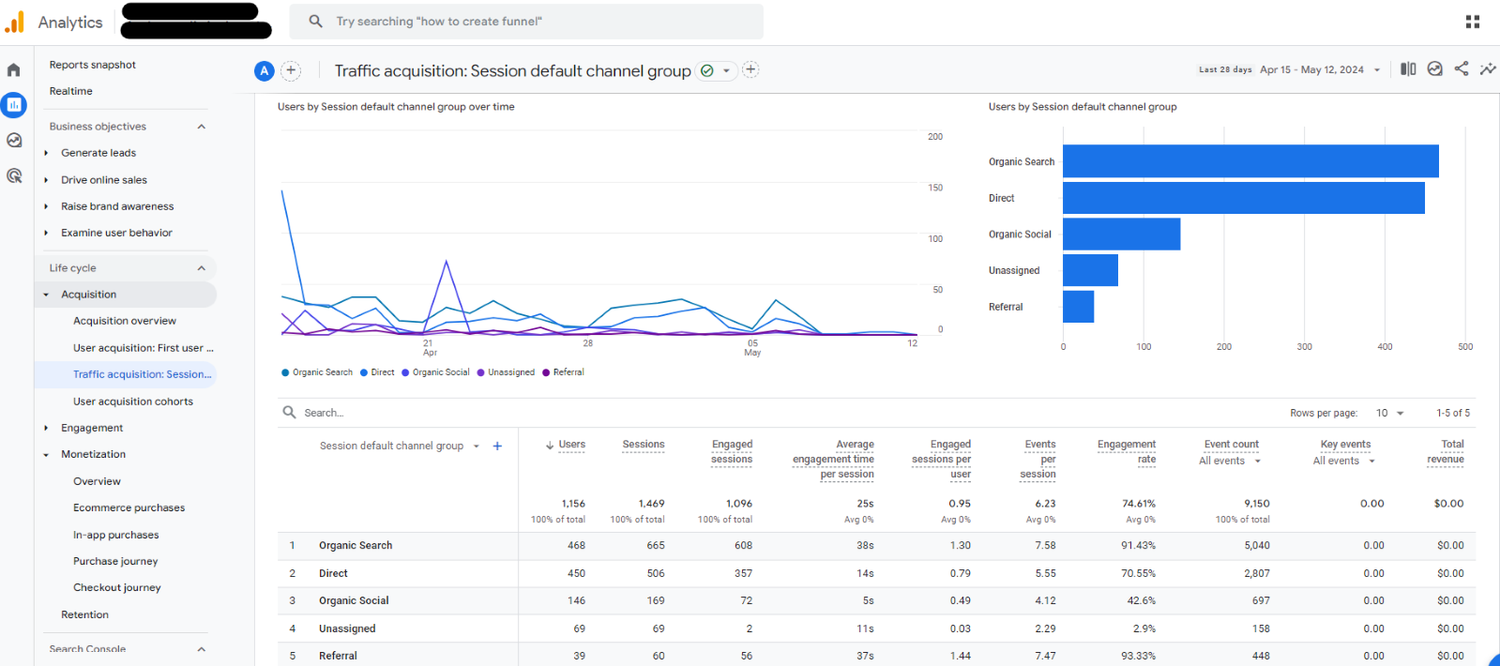
4. Traffic Acquisition – Session Default Channel Group
Not sure if your paid search or SEO has a better ROI? This is your go-to report for identifying which marketing channels drive the most traffic and conversions. This helps you allocate resources effectively and focus on high-performing channels.


How to customise GA4 reports with explorations
The true power of GA4 lies in its exploration capabilities. Here, you can create custom reports tailored to your specific needs by choosing the dimensions and metrics you want to include in your reports.
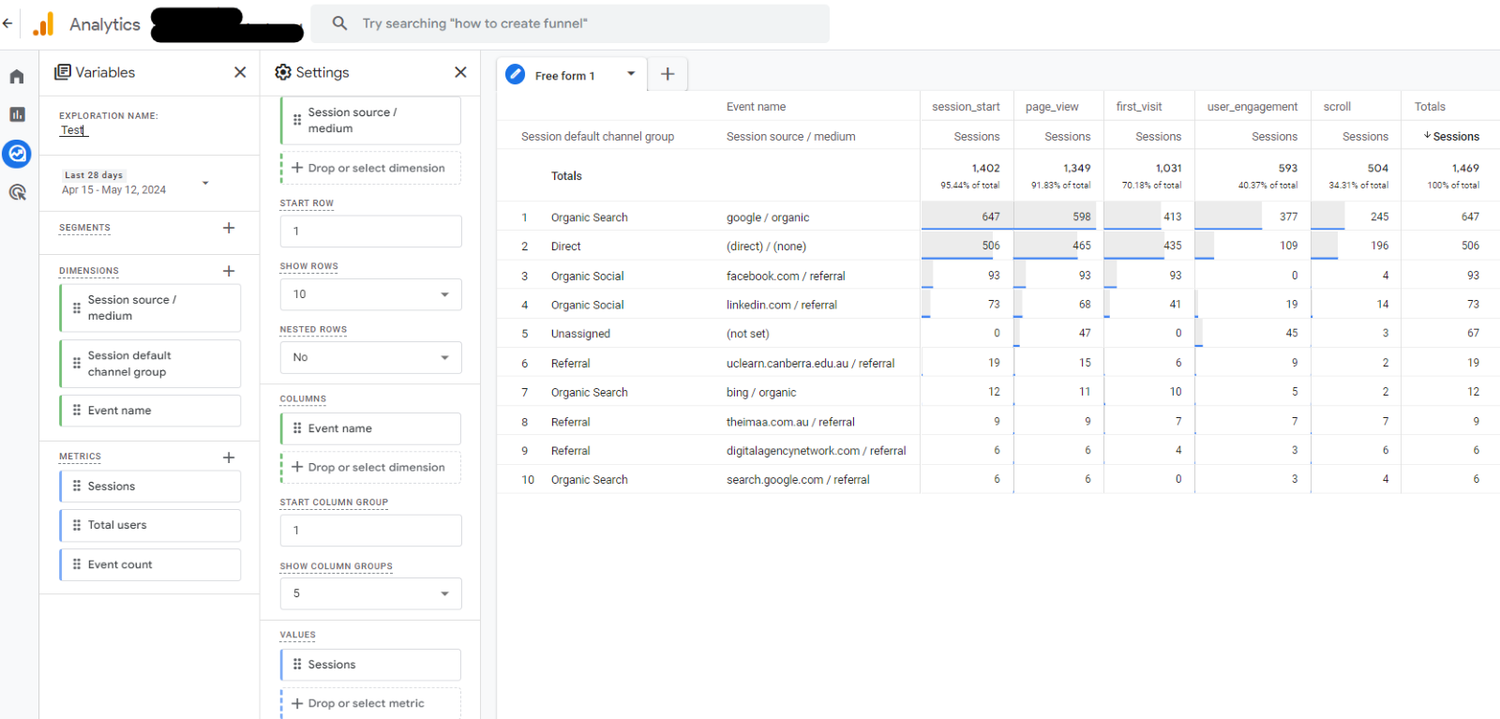
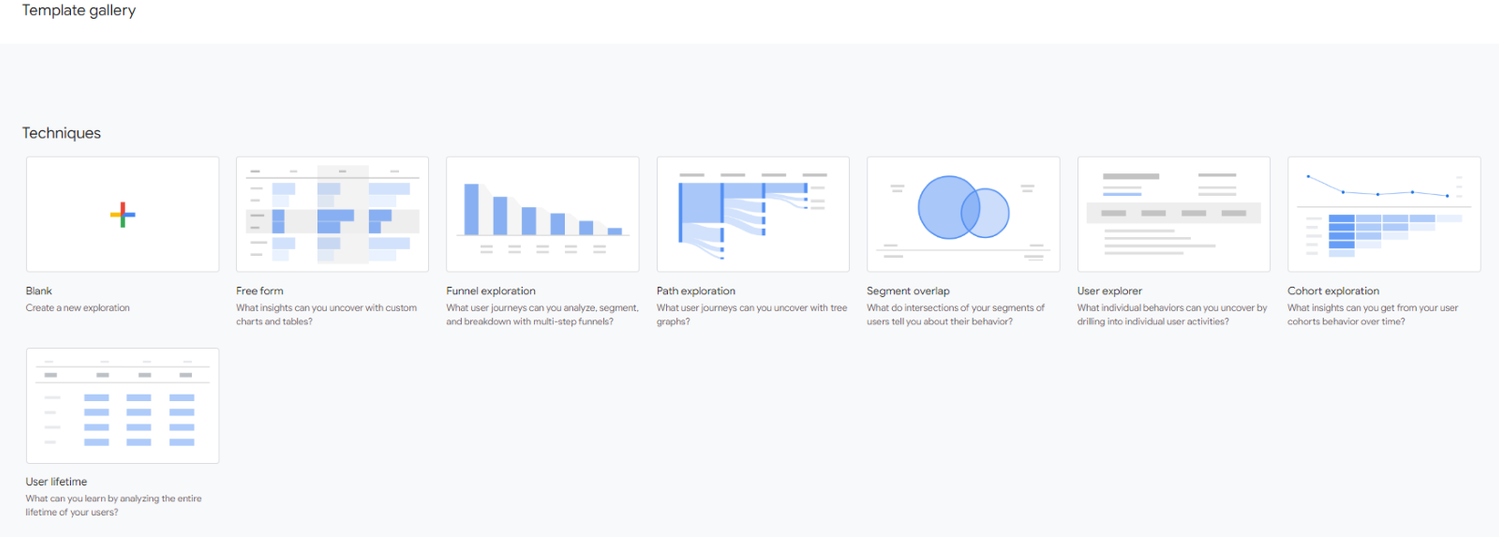
Below we'll focus on two very popular custom report forms: Free Form Exploration and Funnel Analysis.
- Free Form: This blank canvas allows you to drag and drop dimensions (user attributes like demographics) and metrics (like page views or conversions) to build a completely customised report.


- Funnel Exploration: Visualise the user journey through specific conversion funnels. Identify drop-off points and optimise the conversion process.


There are other forms of visual exploration reports as well such as Path Analysis, Segment Overlap, User Explorer, User Lifetime Etc. which you should definitely try to get insights from.


How does GA4 help with reporting?
By effectively utilising GA4 reporting, you can gain a plethora of valuable insights to fuel data-driven decisions. Here are just a handful of ways leveraging GA4 can benefit your business.
- Optimise User Experience: Identify pain points in the user journey and improve the content, navigation, and conversion flows based on user behaviour.
- Enhance Marketing Campaigns: Analyse acquisition data to identify the most effective marketing channels and optimise your campaigns for maximum reach and ROI.
- Drive Revenue Growth: Track conversions, analyse user behaviour within your conversion funnel, and refine your e-commerce strategy for increased sales.
- Improve Personalisation: Leverage segments to tailor content and promotions to specific user groups for a more personalised experience.
Conclusion
Struggling with setting up or interpreting your GA4 reports? Don't worry, our Google Analytics services are here to help.
Chat with Preet Singh, Indago's Chief Data Officer to get started today.

Written by
Adam Soetrisno