Here’s the sticky scenario: your boss and client come storming over the phone, “The AdWords account performance is down again, and I need you to tell me why before lunch!”.
Your regular go-to would normally be a comparison report on account performance from this period to the previous period. Even though the info provided can tell you what’s up and down and how your Impression Share looks, it doesn’t really tell you what could be causing these problems.
The worst part, this could take quite some time to do, and lunch is in an hour.
Enter the auction insights report!
This report alone can only give you a basic overview of how your competitors have influenced your account performance. The real trick here is exporting this report as this gives you access to segments that you wouldn’t otherwise have access to together.
This is where scripts will save the day and your lunch break!
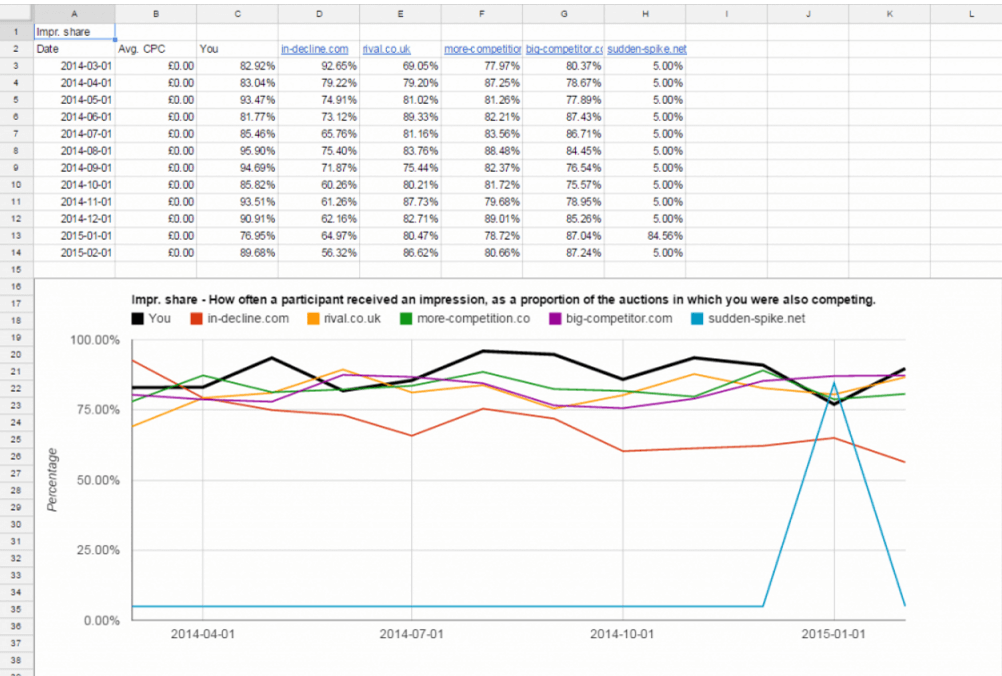
This script isn’t one of the usual AdWords Scripts that run in the AdWords interface, but rather one that runs in Google Sheets. This particular script will break up the entire exported report into something far more useful to a visual guy like myself. Just export the Auction Insights report, adding a segment for Time set to Day and also the Device info and let the script do its work. You’ll now have a full graphic breakdown of each element.
You can easily see if the reason your CPC increased this month was because Competitor A ramped up its budget and started bidding in your arena more vigorously. You might see that Competitor B started targeting the top of the page from Wednesday the 6th of April, or even that Competitor C grew their account and the overlap rate grew to 65% from Monday the 18th. By adding in a few extra columns such as Max CPC, cost and Imp Share you can also get a highly detailed account performance breakdown.
Armed with advanced competitor strategy info such as this (that also happens to be presentation-ready), you are all of a sudden the office hero and your boss and client are praising your superior AdWords analysis skills! No one has to know that this only took 10 mins to find, now go have an early lunch and enjoy yourself.
A Step-by-Step ...
Thanks to http://www.brainlabsdigital.com/blog/tracking-auction-insights-over-time for the work on this script. Please copy the script from here before proceeding.
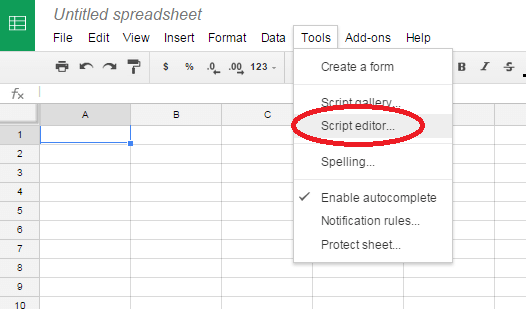
First, create your sheet and go to the Script editor in the Tools menu.

The script editor may already have sample code you’ll need to delete. Paste in the script below.
Change the dateFormat and currencySymbol variables if they are in the incorrect format. Go to the “File” menu and “Save”. Give your project a project name, and you’re done.

Now go to AdWords and download your Auction Insights report, segmented by your preferred Time range. Reset the Date column so it's no longer ”#####” and paste it into the GSheet starting in cell A1.


Written by
Luke Ashmore-Delaney


