
Funnel explorations in Google Analytics 4 (GA4) are an excellent way to visualise and analyse user journeys through multiple stages of a website or an app. Understanding how users move through different stages of your conversion process can help you:
- identify bottlenecks
- optimise your marketing campaigns;
- and improve overall user experience.
Pick a customer journey to measure
Funnel explorations is a default template available in GA4, and you can find it under the Explore section.


Before setting up a Funnel exploration, some prep work is required. You need to define the funnel that you want to visualise and analyse. It could be a funnel that maps users from the homepage to a product page to a thank you page of a form or a purchase journey if your website is transactional.
For this guide, we’ll use the below journey on the Indago Digital website.
Step 1: Homepage → Step 2: Quote page → Step 3: Confirmation page of a lead form
You need to ensure that the steps you have defined in the user journey above can be isolated and measured. This could be views of pages or events – either way; you need to ensure that the setup of your steps is accurate.
The example we use can be defined and measured using page views, as each step has a unique URL.
Add your variables
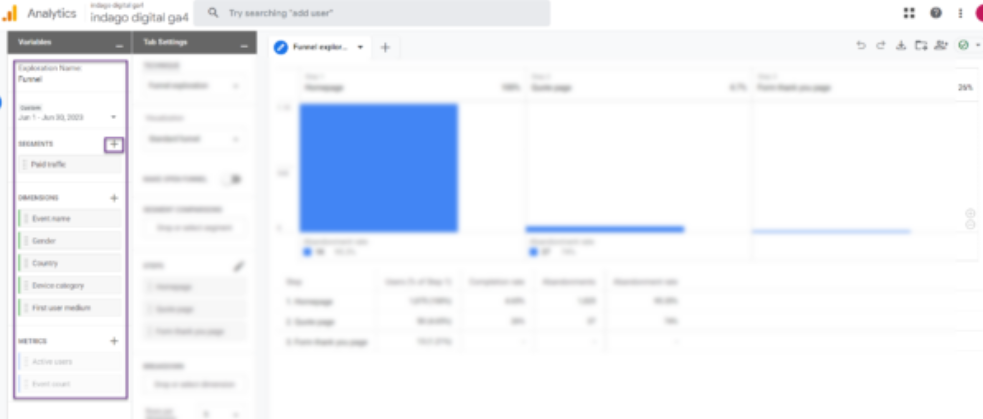
Once you have satisfied the above prerequisites, head to the Funnel exploration template and create a new report by clicking on the template. The default view looks something like this-


The Variables section of this exploration (far left) allows you to define a date range and import the segments, dimensions, and metrics you’ll need for this report. For our example, these are the variables we’d use –


You can import the variables by clicking on the plus sign against each variable type heading. You will also notice that Active users, Event count and Transactions are pre-populated as soon as you create a new Funnel exploration. You can’t add more metrics outside of the ones that are pre-populated because a funnel should look at users (or events and transactions triggered by these users) as a stand-alone metric.
Configure the exploration
Once you’ve added your variables, it’s time to configure the exploration under Tab Settings –


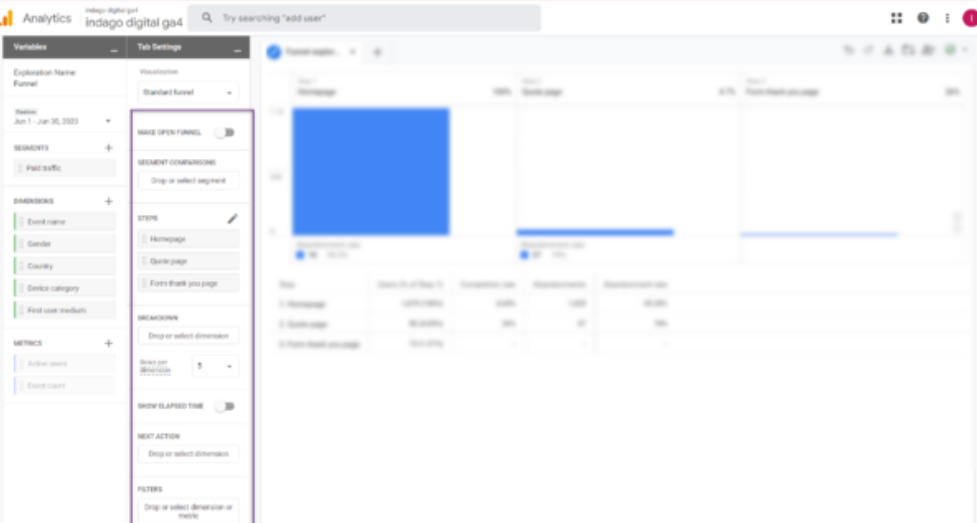
Under Tab Settings, you’ll see the following options:
- Make Open Funnel – This option can be a bit tricky to understand. If the user journey you’ve defined is closed in the sense that users can only move from A to Z in a manner that restricts them to enter the funnel in between, you should choose to keep your funnel closed. Most user journeys are not that restrictive, and users can enter the funnel at any step between A and Z and it is the case for the example we are working with so we will leave this funnel open. You may want to see how your users move through the funnel if it was closed and it’s easily achieved by using the toggle for this option. The data will change based on what option you choose.
- Segment Comparisons – Add the segments you want to use for this exploration here.
- Steps – This is the most important option where you will add the steps you’ve defined. We’ll get back to this option soon.
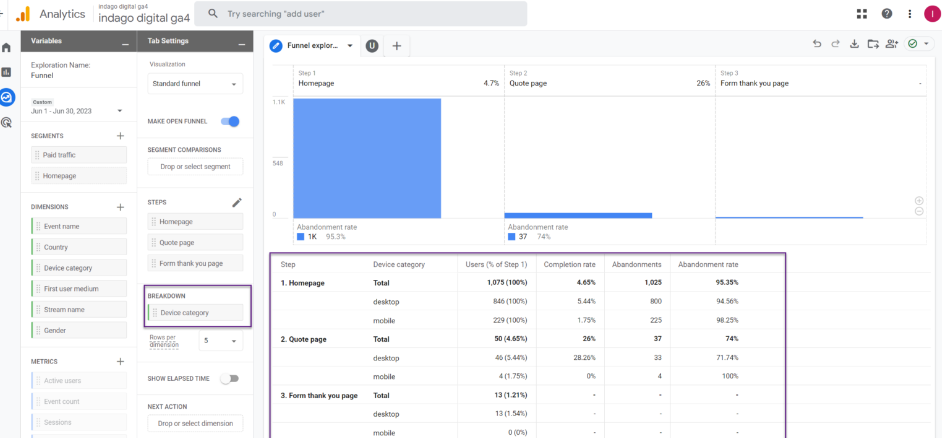
- Breakdown – This option allows you to add a breakdown for the steps you’ve defined. For example, if you wanted to see your funnel data broken down by device, you can do so by adding the device category dimension here.
- Next Action – This option allows you to see what most common actions users are performing besides moving to the next step in the funnel. Again, we’ll come back to this option soon.
- Filters – As the name suggests, you can add a filter you want to use for this exploration here. Common examples are filters for channels, device, geo etc.
Tailor your steps
As mentioned above, selecting your steps is the most important part of the process. For the example we are using, the steps have been added as below –


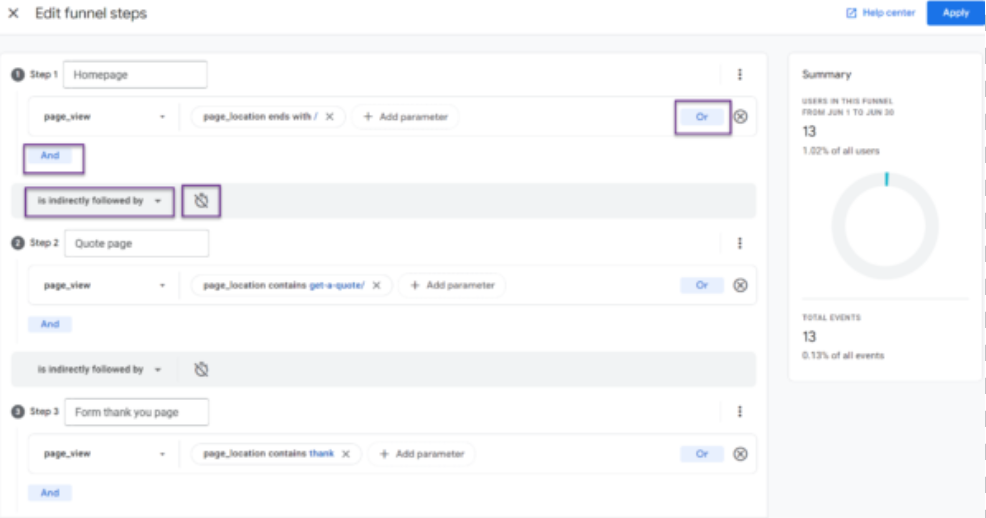
You can get to this screen by clicking on the pencil icon next to the Steps heading under Tab settings.
Once on this screen, you will notice:
- The option to create And / Or conditions for each step.
- The option to have the previous step followed indirectly or directly by the next step. Even though this option might sound like the open/closed funnel option, it’s not. This option defines how your steps follow each other. If your funnel goes from step A to B to C in that order and users can’t go back or elsewhere, you should choose the “is directly followed by” option from the drop-down. Most funnels don’t work in that manner and leaving this option to the default “is indirectly followed by” is most likely going to be accurate.
- The timer icon option allows you to define a time constraint within which the next step must follow. For example, if your user journey is time-sensitive, this option can provide useful insights.
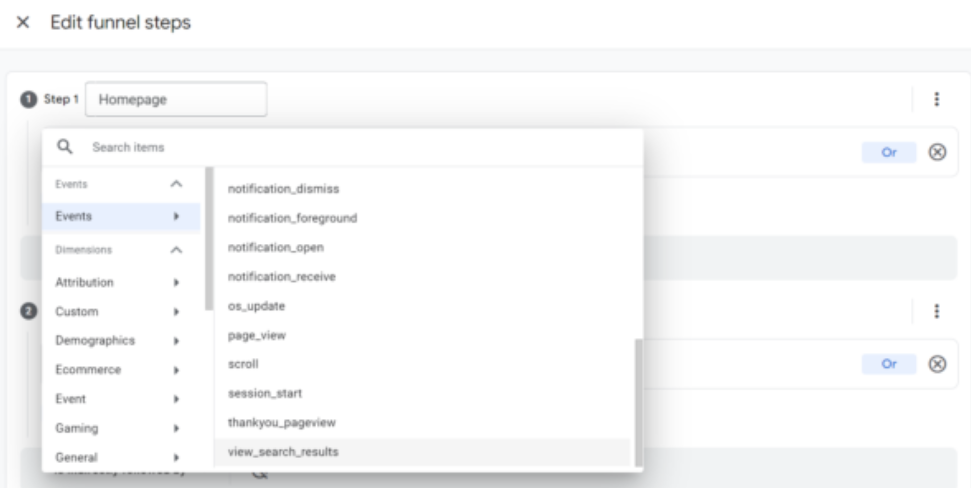
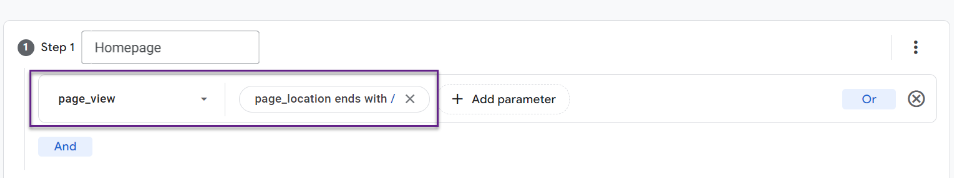
GA4 provides a lot of flexibility when creating a step in the funnel. You’ll notice that you can use almost every dimension (including custom dimensions) and parameter to create steps –


For the example we are using, we simply used a combination of Event = page_view and a page_location parameter condition. The below step defines users who have viewed the homepage of the Indago Digital website.


Analyse the funnel
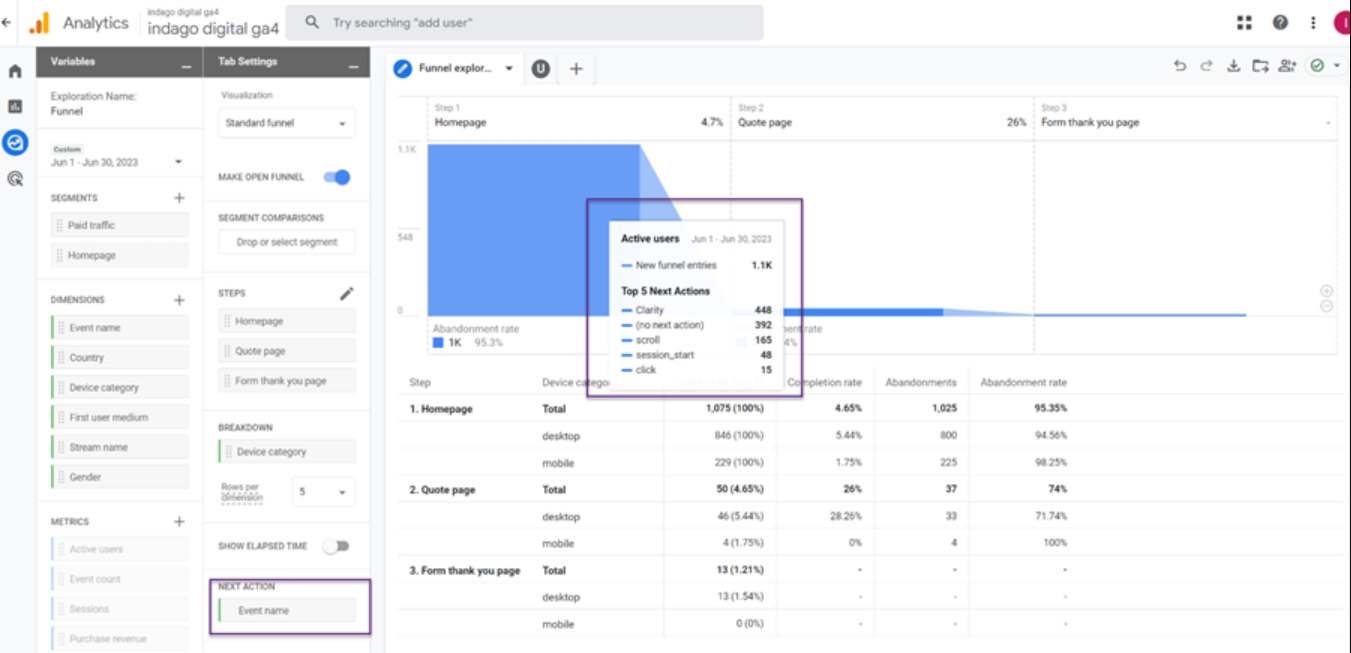
After you’ve configured the settings, you are ready to analyse the funnel. For our example, the funnel looks like this –


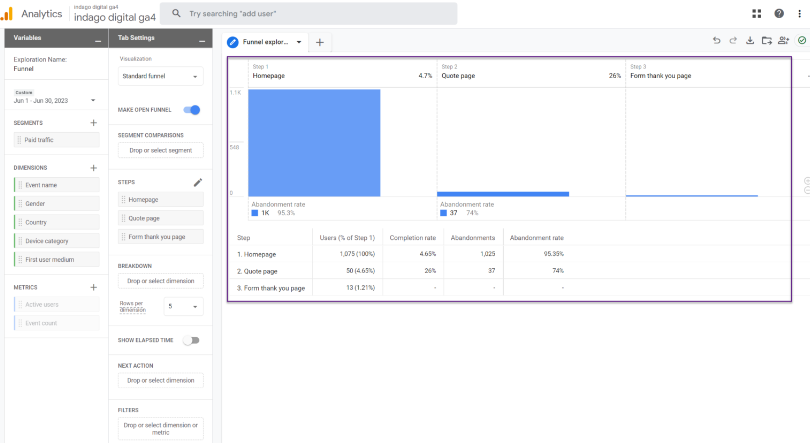
The data is self-explanatory and shows completion and abandonment rates for each step.
Adding a break-down can provide additional insights and looks like this –


Additional features
Discover some useful features to help make the most of your reports.
You can right-click on each bar graph to open up a couple of options –


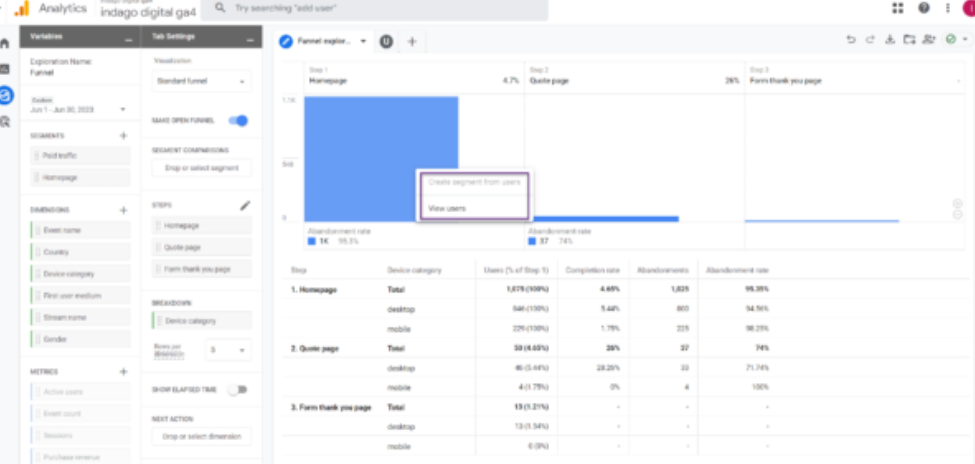
- Creating segments from users allows you to create segments that you can use elsewhere in GA4 directly from this visualisation.
- You can only create segments for closed funnels (why this option is greyed out in the screenshot) and funnels with users indirectly following previous steps.
- You can view users for each step, and clicking on that option opens a user exploration report in another tab on the same report.
You can also change the visualisation of the funnel to Trended if you want to see the steps trending over the selected time –


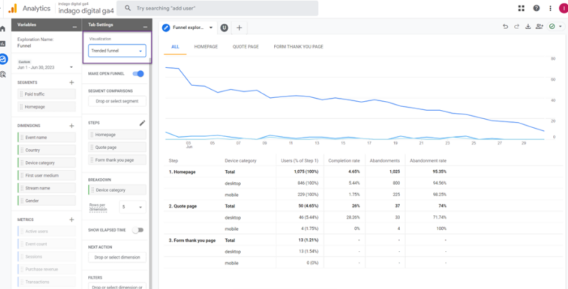
Adding the Next Action option shows data on the most common user actions following each funnel step. Adding this option to our example looks like this –


Final thoughts
Funnel explorations can provide valuable insights, and there are almost unlimited configurations you can choose from when creating steps and adding breakdowns and filters. Everyone should be looking at this data irrespective of the type of website or industry. Let us know how you are using GA4 Funnel explorations and if you’ve discovered new features and uses of this excellent report.

Written by
Preet Singh