Where does your business make its revenue from?
No, not like that, I mean which channels drive more revenue than others?
Which gets people interested in your product? Which influences your client’s decisions and continuously reminds them about you? Which close sales? Are you grouping like channels properly, or just letting Google Analytics potentially get it wrong?
This is the basic premise of Attribution Modelling. And exactly why it’s important to every business! Attribution models award more, or less, credit to a channel based on how it performs as part of the sales process.
Depending on what you would like to measure, you can adjust these levels to award more credit for the channels that open the path (first click), influence the path (midpoints), or close the path (last click).
Standard attribution models
Before heading into what the models tell you, you’ll first need to understand how they work. Let’s do a quick breakdown of the seven basic standard model types available in GA;


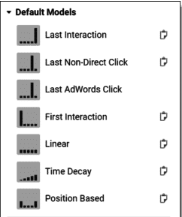
These consist of 6 major categories and to understand them it helps to understand how GA categorises digital channels. The most important channel to understand is:
Direct
As its name ensues, it includes direct traffic to your site from people who know and love your products (and bookmarked your site!), but it also includes traffic from unclassified sources;
- Traffic from emails with no or broken UTM’s.
- Links from Word docs, PDFs, instant messenger apps, badly managed marketing, etc.
- Or, anything else that GA can’t categorise or see as an unknown source.
As you can see, this is a big group of UNKNOWN’s + your marketing efforts are working well. As such, we generally discount this activity a bit.
First Interaction
100% of the conversion credit is awarded to the first interaction in a conversion cycle. In other words, which channel converted that person off the street into your customers?
Linear
An equal percentage of the conversion credit is split between all channel touchpoints the person is connected with on their path to conversion. So, for instance, if they clicked a banner, then a week later a Facebook ad, then an AdWords ad, visited through your email, then typed your business into Google and visited through an SEO link, each of the 5 contact points would get 20% of the conversion.
Time Decay
The closer to the touchpoint to the conversion, the higher the percentage of the conversion credit it is awarded. For the example above, SEO gets the most, and the Banners get the least.
Last Interaction
100% of the conversion credit is awarded to the last point of contact with any of your channels that generate the conversion. In other words, which channel closed the sale? It is important to note that this is the GA default for all reports.
Last Non-Direct Click
100% of the conversion credit is awarded to the last point of contact with your advertising channels that generate the conversion. In other words, what happened before Direct if Direct was the last click before the conversion?
Position based
The first and last interaction get 40% of the conversion credit equally, and all other channels share the remaining 20%. So for the above, Banner and SEO get 40% each, and the other 3 channels get 6.66%.
Understanding this breakdown is important as each model changes the data output, as you’ll see in a moment. It's these changes that tell the story.
Attribution Models
So what they tell you
So, before you begin, decide what it is that you would like to measure. As with everything, if you don’t have an aim, you’ve got no chance of a goal. [I couldn’t resist the football reference, sorry]
Comparing 2 or 3 attribution models together gives you an idea of how channels behave in generating different types of conversions, where they are likely to fall in the sales path (so what type of messaging you should be using for that channel) and so on.
If, for instance, you were to look at the conversions that your Display activity generates, you’ll probably see a very low value (remember that the GA default for all reports is Last Click). This, however, does not mean that the channel is terrible at generating sales; it just means that this channel's strength is not closing the sale, so perhaps its better at opening or assisting.
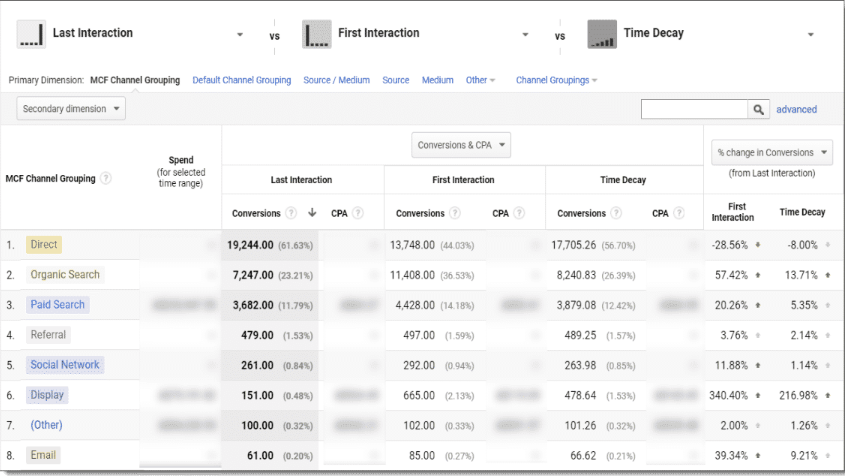
Let’s look at the following example;


First up, notice the difference in values between Last Click and Last Non-Direct Click. Notice how Direct values plummet, but everything else improves? That’s our first clue that Non-Direct traffic is where we’ll find our answers, the first being which channel closes the most sales – Organic.
Note: The above does not compare conversion rates, so though SEO generates the most conversions, it may require 100,000 visitors to generate them (13.3% conversion rate). AdWords, however may only need 20,000 visitors to generate those conversions (24.1% conversion rate), meaning the channel is more effective.
Looking at the data we see that at Last Click, the display only generated 151 conversions, at Last Non-Direct Click, it generated 173; and as a Position, it has assisted in generating 453 conversions!
With a 200.44% increase in conversions, you can easily see that your Display activity has value in the sales path. We can deduce that Display’s strength is in opening the sales path, not so much in closing it. More on that later.
Let’s look at Paid Search. This may have only closed 3,682 sales, but if we remove Direct as the last point of contact, we see that it was the final step before a Direct entrance and assisted with generating 4,827 conversions, a 31.1% increase. From this, we can deduce that Paid Ads are vitally important in closing sales (11.79% of all sales even at the Last Click) but also as the second last step before the conversion takes place.
From the SEO perspective, it’s already a great converter, closing 7,247 sales. But if we go one step back, this figure almost doubles to 13,349 conversions (an 84.2% increase!). But then, comparing this to the Position-based model, there is only a 24.46% increase in conversions. From this, we deduce that SEO is highly effective at closing sales, but not at opening them.
Let’s compare the data above but with different models to see what other insights we can gain.


First, Last and Time Decay tell us a little more about where the channel slots in. First, closer to the end or absolute last? However, as we would like to see how our marketing channel performs, we’ll change Last Interaction to Last Non-Direct.


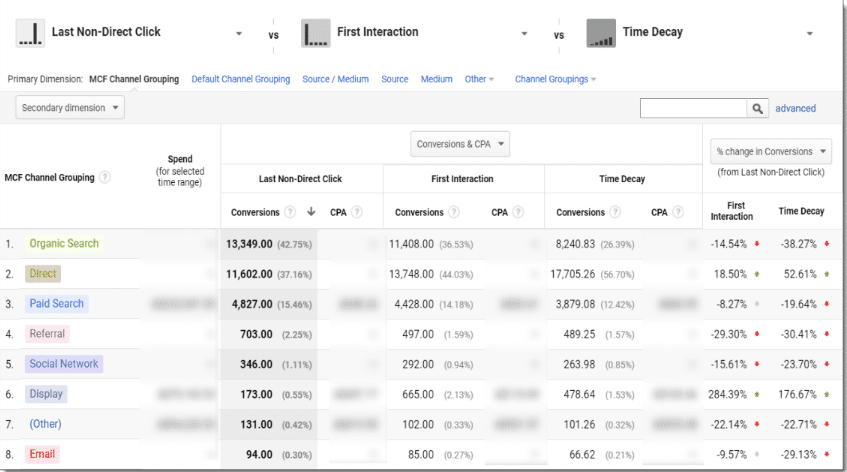
Suddenly, we get a very different picture.
- Organic is excellent at being the last channel touchpoint while still being good at the first step.
- Paid Search closes a lot more sales and Referrals are exceptional at closing.
Now let’s compare a few more models to determine where these channels fit into the sales path. A comparison of these 3 models will tell us how a channel performs at closing, compared to any stage of the path and then how close it slots to the end of the path.

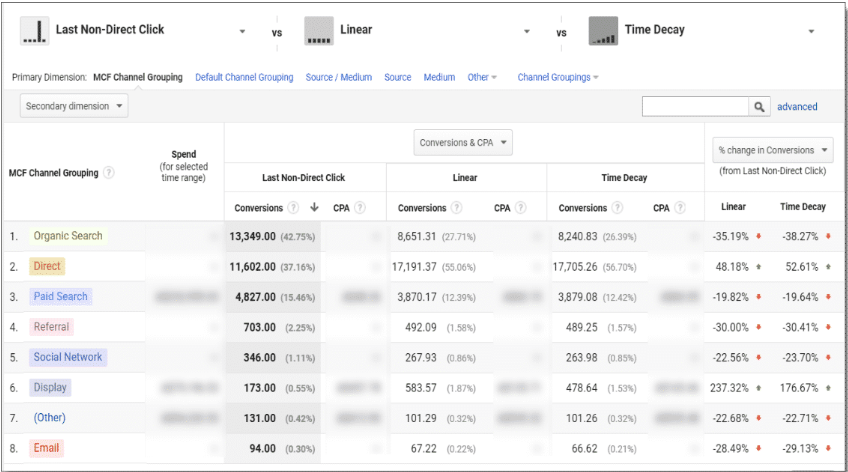
- For Organic, we see that there isn’t much difference between the Linear model and the Time Decay model, but a very high value as a Last Click. Once again, this proves how valuable this channel is at closing a sale.
- Paid Search, we also see a high Last Click and lower mid-sections. This leads us to deduce that it’s a good opener and closer. But not so great at the mid-sections of the sales path. Could this mean that our ads need to be adjusted? Or is our strategy all about the brand (end of path) vs nonbrand (research and start of path).
- Display, on the other hand, has a low closer (as we’ve seen above) but seems to be involved in multiple touchpoints in the middle of the sales process as the linear figures are very high. Not as high as the First Click figures, but the importance of the channel is clear.
- Referral is also a channel that falls near the end of the sales process. On opening, see 497 conversions; the midpoints vary at 489.25 – 492 and close off at 703!
The above data is only eCommerce data, but if you have multiple stages of the sales process, such as enquiries and bookings or sales. Select just the conversion metric you would like to see and perform the above comparisons.
You’ll quickly see which channels are better at generating enquiries and which are better at sales. If you know that 80% of enquiries return to sales and take 15 – 25 days to do so. Now you know where to concentrate your efforts for the next 15 days, and then you boost the channels that close sales.

Written by
Preet Singh