
Then, the more prominent online software suites like SEMrush jumped in the gap Google left behind and started offering ‘non-provided’ solutions for a premium price.
Luckily, with the Search Console connector for Google Data Studio, a workaround provides you with traditional page-level query data like impressions, clicks & CTR and the average ranking position.
Create a Landing Page by Query table in Google Data Studio.
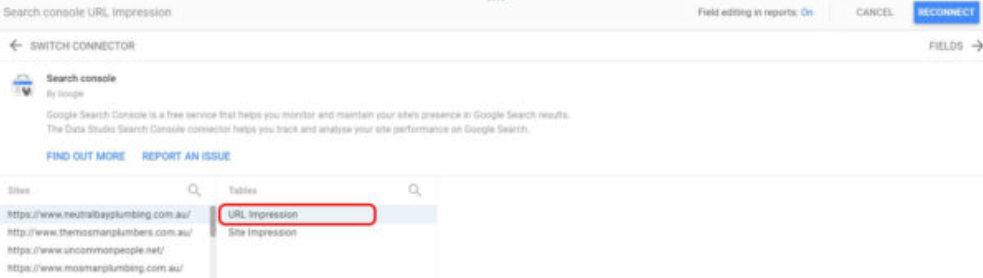
First, create a Landing Page table report in Google Data Studio based on Google Search Console. Make sure to select the URL impressions when you set up the Data Source (Image 1).
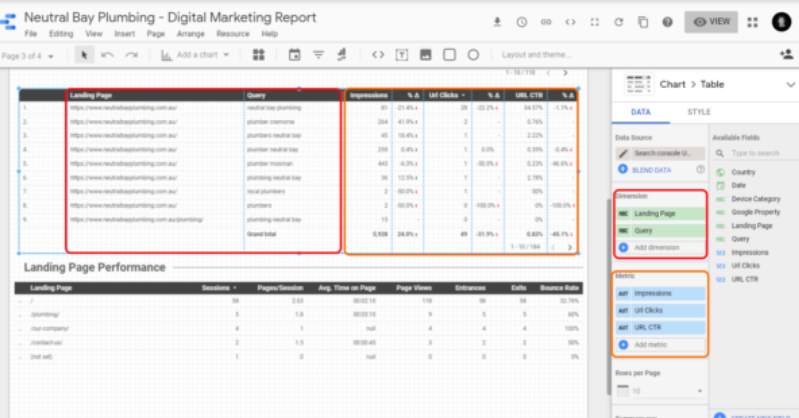
Once you have set up the connector and inserted a table onto your report page, select Landing Page & Query as Dimensions, Impressions, URL Clicks & URL Ctr as Metrics and sort by URL Clicks.
Using my brother-in-law’s website as an example – put together, it will look something as shown below (Image 2).


Create a search query by average position table
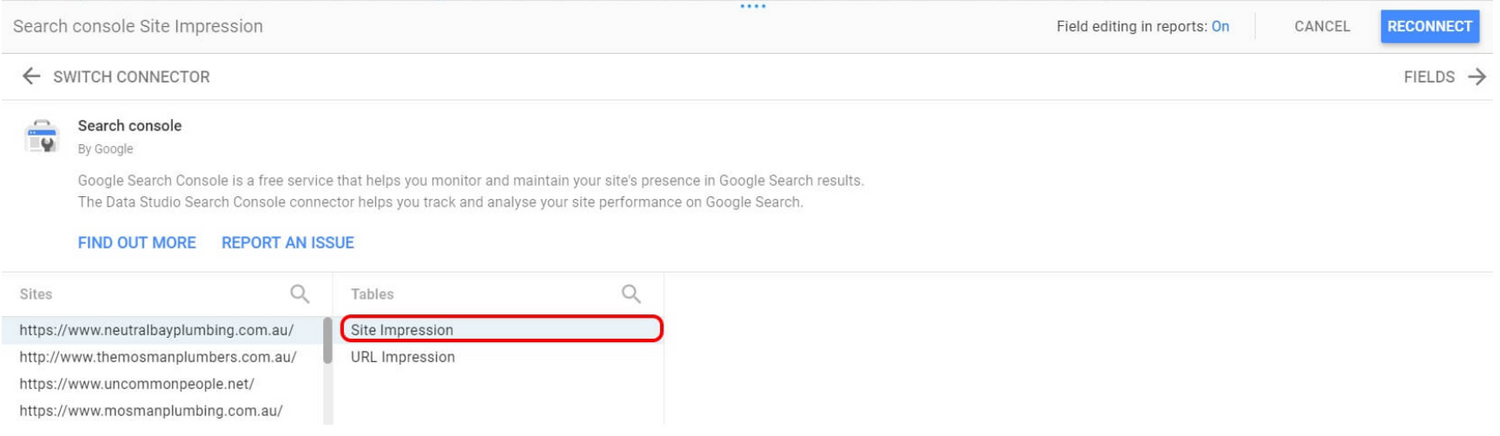
Next, create another table. This time, use the Search Console Site Impression as a data source to put together a table report that shows at least Query & Average Position.


Export to Google Sheets
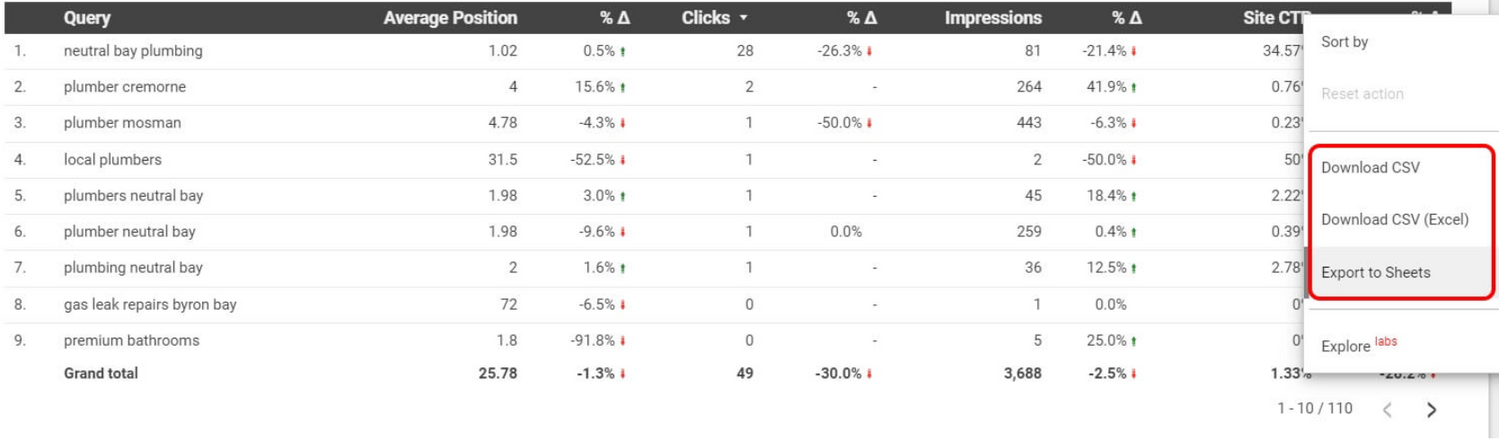
Once you have put both tables together, the next step is to download the data from these tables. For this, make sure you switch back to the View mode.
You will see three dots next to the table on its top right. When you click on these, a menu lets you download the table data as an Excel file or export it to Google Sheets. For the report we are creating, it doesn’t matter which you choose. More important, though, is to make sure to select the data range you want to get the data for.


Match the data from both tables with a VLOOKUP
The next thing I am going to do is to match the data from the table with the average ranking for each query with the data from the landing page metrics table.
So go into the landing page data sheet and add a column called Average Ranking. Then, in the row with the first query (this would most of the time be row 2), add a vertical lookup that looks for the Average Position of the corresponding question in the sheet with the data we have downloaded from the average position per query Data Studio Report.
So, in the example below, I have looked up the Average Position of the query ‘Neutral Bay Plumbing’ in the sheet Average Position:
=VLOOKUP(B2,’Average Ranking’!$A$2:$B$113,2,FALSE)


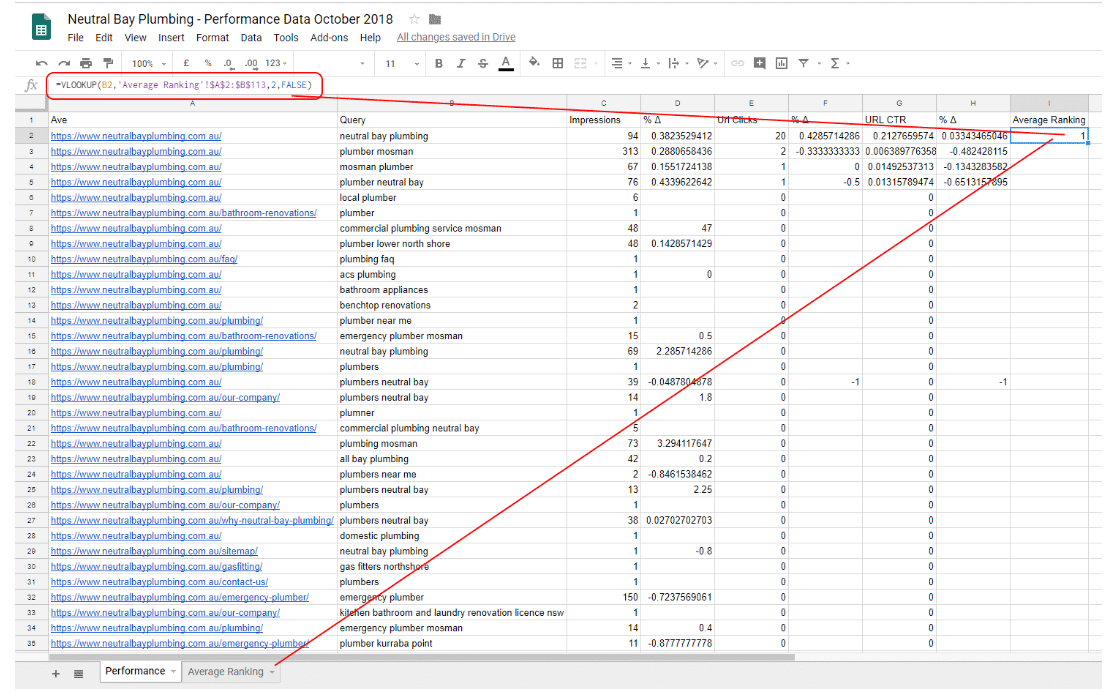
Just drag down the formula, and you will have the average position of your landing pages for each query they had at least 1 impression for!
Congratulations, you have just recreated a report with search query data at the landing page level!

Written by
Darren Friel