But it’s often the case that marketing managers, and even some seasoned SEOs, aren’t able to create actionable reports from their Analytics accounts. So in this article, I’m going to show you how to create 2 different custom reports which will give you practical takeaways to enhance your technical SEO auditing.
The two reports I’m going to go through are:
- Finding high-priority broken internal links.
- Individual page speed insights.
Finding high-priority broken internal links
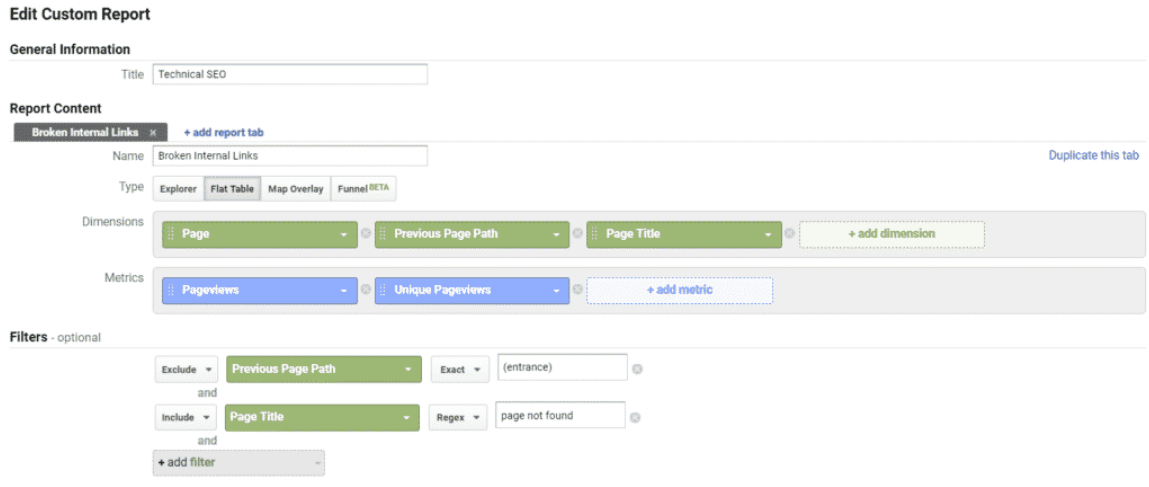
There are a few different ways in which you can decide on which pages are deemed to be high priority. But for the sake of this example, I will be using Unique Page Views as the primary metric/indicator of high-priority pages i.e. those with a higher number of Unique Page Views will be of a higher value to my website. Look at the image below for how the report creation should look on your screen, and then further down a breakdown of the different elements.


Report Type
It’s important to note that when making this report, ensure that your report ‘Type’ is marked as ‘Flat Table’ – see the image below for reference.
Report Dimensions
In terms of the dimensions you want to include in your report, there are three key items that I’m going to be looking at here; Page, Previous Page Path, and Page Title. Here’s a breakdown of what each of those means:
- Page: This is the page that is returning a 404 response.
- Previous Page Path: This page shows how users reached the 404 response, i.e. the path they took to arrive at the broken page.
- Page Title: We need to know the respective page titles so that we can focus on pages that are returning a 404.
Report Metrics
You can use whatever metrics suit your needs and desires. But in this circumstance, I will be looking at pageviews and unique pageviews. If you want to get deeper insights and you’re familiar with GA, then by all means, include or switch up the metrics you use – you can even just rely on one metric if you like.
- Page views: The number of times users have viewed the page being analysed.
- Unique Page views: Just as the name suggests, this is the number of times unique users view the page. i.e. the same user may view the page 50 times, but it still only counts as one unique pageview.
Report Filters
- Exclude – Previous Page Path: As this report aims to find broken internal links, I’m going to exclude users who have randomly typed a URL directly into the search engine (AKA ‘entrance’).
- Include – Page Title: We want to include all pages that returned a 404 status. Depending on your website and how you’ve set up your 404 display, ‘page not found’ could also be replaced by ‘404’ or some other equivalent message.
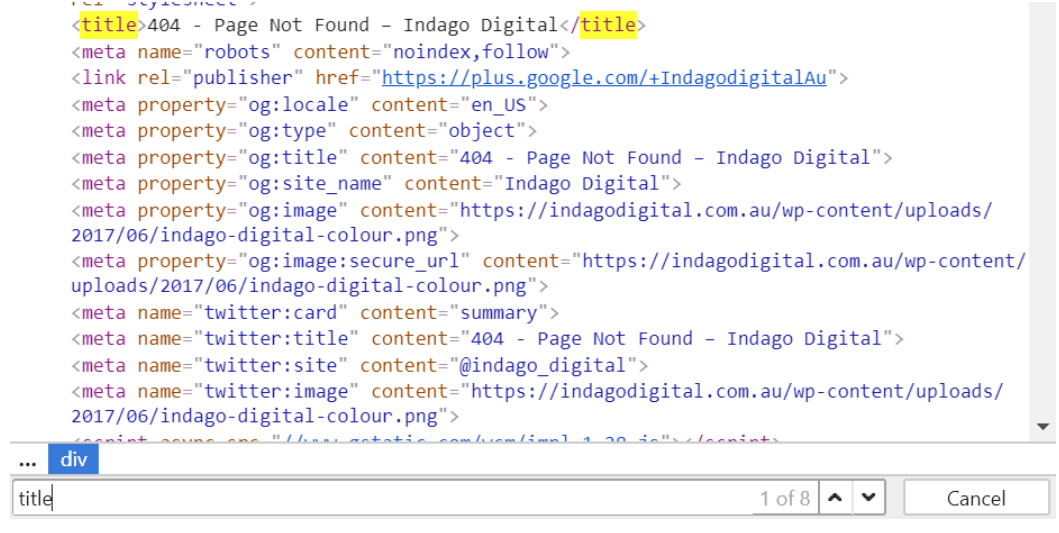
If you don’t have a Chrome extension to help you identify the page title, then all you need to do is right-click on any part of the page, hit ‘inspect’ and find the title tag within the HTML.


From here, all you need to do is run the report, and you’ll get the list of URLs you need, which you can then dissect and organise by their priority.
Custom reports for page speed insights
Many of us SEOs use Lighthouse as a tried and true method of determining technical recommendations for a website.


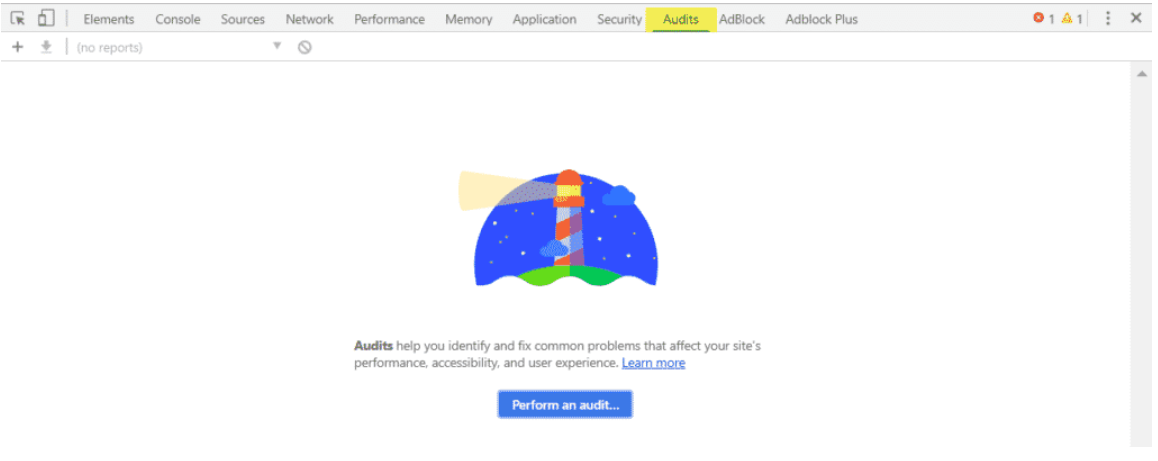
The problem with relying on this tool as a sole diagnosis is that similar to page speed insights, it bases all of its testing on one page – the page you tell it to test (usually your homepage). Although it might give you a decent idea of likely problems that will overlap as issues with other pages on the site, it is also heavily focused on Chrome’s browser recommendations.
So to supplement the Lighthouse tool, we can use Google Analytics’ Custom Reports as a way to look at page load times within different browsers to help tailor recommendations a little further.
Below, you’ll see a screenshot of another report being created. It’s an example of a basic way to break down page load times, allowing me to look at where to focus my page speed audit. Sidenote to this: if you haven’t already, play around with the different dimensions and metrics GA offers and get comfortable with how many variations there are when creating a report.


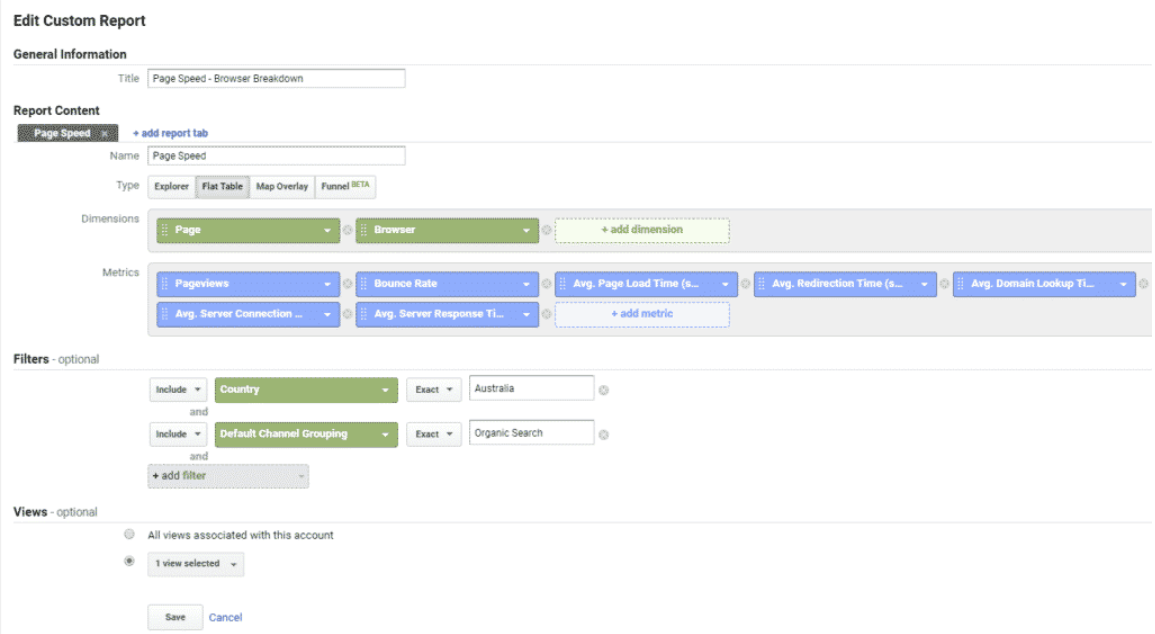
Like the previous example, this one has been broken down by page, but this time with a secondary dimension looking at browsers. I also want to add filters for traffic coming from the country I’m concerned with and ensure I’m focused on the relevant traffic channels – in this case, it’s organic traffic.
Insights from load time metrics
Running the Report
Again, all you need to do once you’ve got your inputs right is run the report.
- Average Page Load Time (Sec): This is the time that it takes to load the entire page from the moment the link was clicked.
- However, we should be wary of using this as the load time benchmark because it doesn’t necessarily mean that users are not already consuming content above the fold.
- It’s often the case that page load time seems worse than it actually is because of slow-loading widgets that have little to no impact on the user experience. These slow-loading widgets can have a significant impact on the results you see in page load times.
- Average Redirection Time (Sec): Consider using this to see if there’s any archaic internal links that are making page load times longer for a user.
- Average Domain Lookup Time: Consider switching to another DNS provider for lower and more consistent response times.
- Average Server Connection Time & Average Server Response Time: This can determine whether we need to reduce the backend processing and look at placing the server locally (if it’s currently being hosted overseas).
As Google becomes increasingly user-centric rather than algorithmically focused, SEOs should also focus on not looking at certain metrics (e.g. Avg. Page Load Time) as the only benchmark. The focus should be on metrics that are specifically relevant to user experience – so in this case, improving particular page load times so that users can start consuming content as early as possible. Hence, looking at a wide spectrum of metrics is crucial for any advanced technical SEO audit.

Written by
Adam Soetrisno